wordcloud_map()
- wordcloud_mapper.wordcloud_map(df, nuts_codes, words, word_counts, scale=2.0, rendering_quality=1, colour_func='random', colour_hue=None, min_font_size=4, max_font_size=None, max_words=200, relative_scaling=0.5, prefer_horizontal=0.9, repeat=False, border_scale='01M', border_sharpness=100, nuts_year=2021, coord_system=3857, shapefiles_path=None)[source]
Create a wordcloud map using data from a DataFrame.
- Parameters
- dfDataFrame
DataFrame object containing columns with NUTS codes, words and word counts.
- nuts_codesstr
Name of the column in the DataFrame containing the NUTS codes.
- wordsstr
Name of the column in the DataFrame containing the words.
- word_countsstr
Name of the column in the DataFrame containing the word counts.
- scalefloat (default = 2.0)
The scale of the produced figure. The given value works as a multiplier of matplotlib’s default figure size. If
scale = 1.0, retains default figure size. Ifscale > 1.0, figure gets bigger by a factor of scale (e.g. 1.5 means 50% bigger). Ifscale < 1.0, figure gets smaller by a factor of scale (e.g. 0.5 means 50% smaller).- rendering_qualityint (default = 1)
The rendering quality of the words in the wordcloud. Higher values produce better-looking / sharper words but take longer to run.
- colour_funcstr (default = “random”)
String indicating which colour function to use. Available values:
"random"sets a random luminosity between 0 and 50 for each word within a region."frequency"sets the luminosity of each word according to their relative frequency or word count, e.g. if the most frequent word A has value 100 and the second most frequent word B has value 50, word A receives a luminosity = 50 and word B = 25. Produces best results whenrelative_scaling = 1."rank"sets the luminosity of each word according to their absolute rank, e.g. if there are 5 words, the most frequent word receives luminosity = 50, the second most frequent receives luminosity = 40, and so on. Produces best results whenrelative_scaling = 0.- colour_hueint or None (default = None)
Sets one specific hue in the HSL colour system for all regions. Choose an integer between 0 and 360.
- min_font_sizeint (default = 4)
Smallest font size to use. Word placement will stop when there is no more room to fit words of this size.
- max_font_sizeint or None (default = None)
Maximum font size for the largest word. If None, a relative sizing based on the height of the image is used.
- max_wordsint (default = 200)
Maximum number of words to be included in wordcloud for each region.
- relative_scalingfloat (default = ‘auto’)
Importance of relative word frequencies for font-size. With
relative_scaling = 0, only the ranking of words is considered. Withrelative_scaling = 1, a word that is twice as frequent will have twice the size. In datasets with highly uneven word frequencies, relative_scaling = 1 might lead to very few words being fitted, so a value of around 0.5 often looks better. Ifrelative_scaling = 'auto'it will be set to 0.5 unlessrepeat = True, in which case it will be set to 0.- prefer_horizontalfloat (default = 0.9)
The ratio of times to try horizontal fitting as opposed to vertical. If
prefer_horizontal = 1, no words will be placed vertically. Ifprefer_horizontal < 1, the algorithm will try rotating the word if it doesn’t fit.- repeatbool (default = False)
Whether to repeat already-placed words until
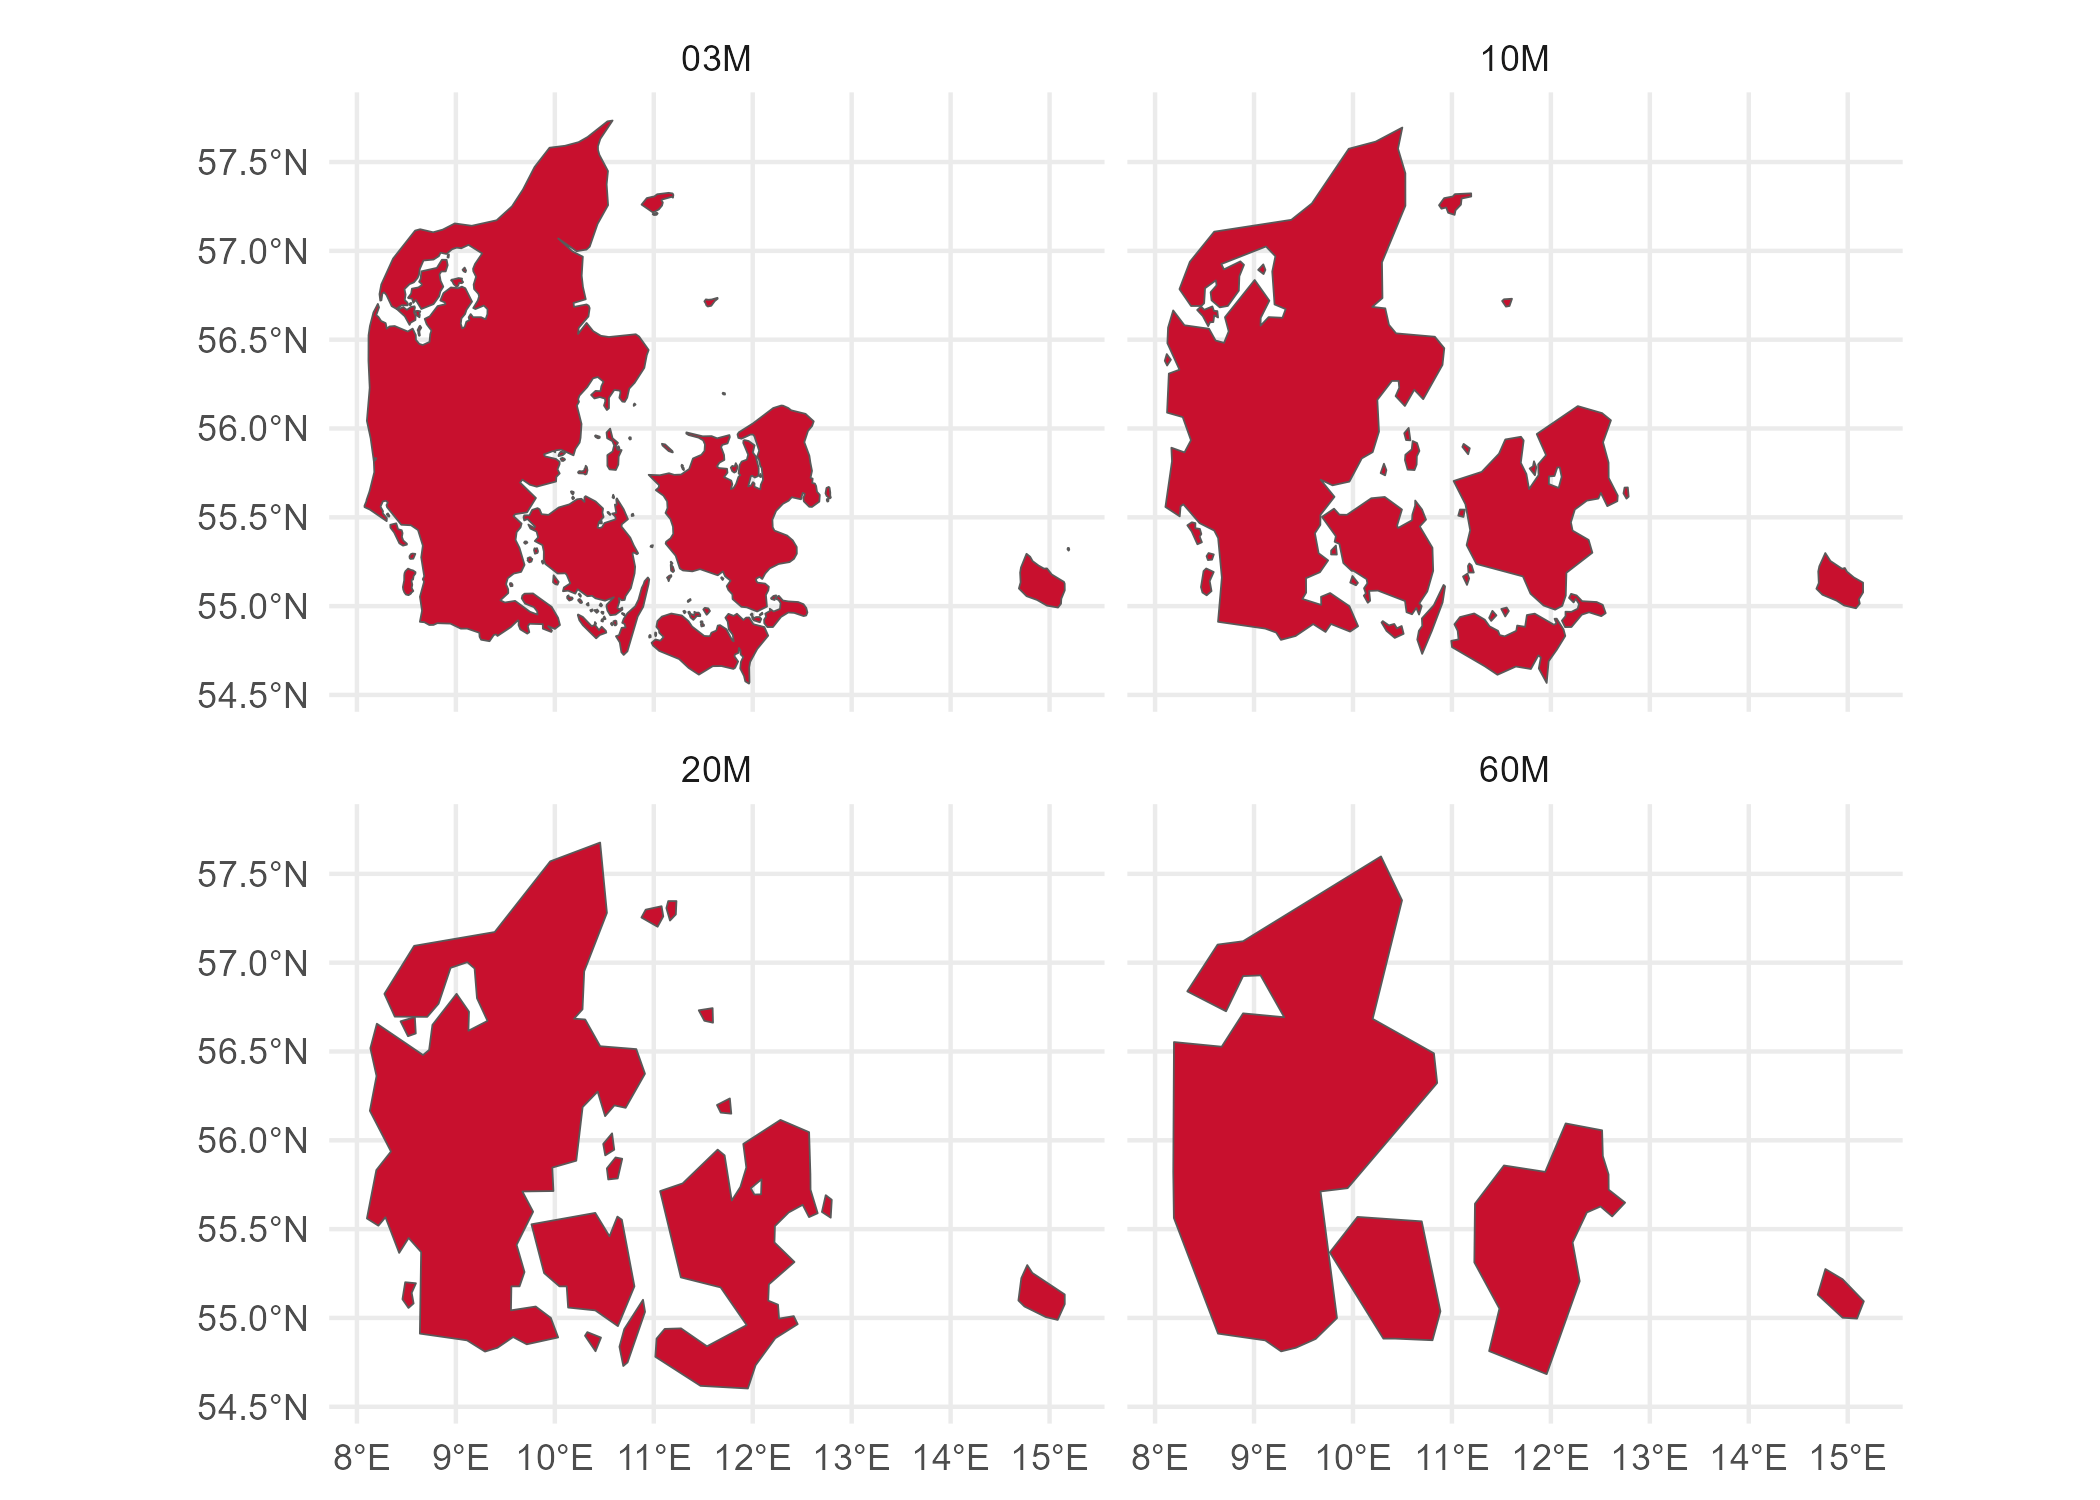
max_wordsormin_font_sizeis reached.- border_scalestr (default = “01M”)
How detailed the regions’ borders (i.e. the polygon shapefiles) should be, based on the official NUTS values used to download shapefiles. Smaller scales (e.g. “03M”) mean more detailed polygon shapes and thus longer running times. Larger scales (e.g. “60M”) mean less detailed polygon shapes and thus shorter running times. Available values:
"60M","20M","10M","03M"or"01M". For a visual explanation, see https://raw.githubusercontent.com/ropengov/giscoR/master/img/README-example-1.png- border_sharpnessfloat or int (default = 100)
Defines how sharp the regions’ border lines look. Higher values create sharper regional border lines but might take considerably longer to run. Change to higher values if zooming into the map is necessary. The value used relates to the DPI (dots per inch) used when generating the mask images.
- nuts_yearint (default = 2021)
The year of NUTS regulation, e.g. 2021, 2016, 2013, 2010, 2006 or 2003.
- coord_systemint (default = 3857)
4-digit EPSG code (a unique identifier for different coordinate systems). Available values:
4326(WGS84, coordinates in decimal degrees),3035(ETRS 1989 in Lambert Azimutal projection with centre in E52N10, coordinates in meters),3857(WGS84 Web Mercator Auxiliary Sphere, coordinates in meters).- shapefiles_pathstring or None (default = None)
Reads shapefiles from a local filepath instead of downloading from GISCO’s database as per default. Useful when internet access is limited. Works with .shp or .zip files. To get local files, visit: https://ec.europa.eu/eurostat/de/web/gisco/geodata/reference-data/administrative-units-statistical-units/nuts
- Returns
- matplotlib.figure.Figure
The wordcloud map as a matplotlib Figure object.
resize_map()
- wordcloud_mapper.resize_map(fig, scale)[source]
Resize the matplotlib figure by a given scaling factor.
- Parameters
- figmatplotlib.figure.Figure
A matplotlib Figure object.
- scalefloat
The rescaling factor as a multiplier of the figure’s current size. If
scale > 1.0, image gets bigger by a factor of scale (e.g. 1.5 means 50% bigger). Ifscale < 1.0, image gets smaller by a factor of scale (e.g. 0.5 means 50% smaller). Ifscale = 1.0, no change is made.
load_companies()
- wordcloud_mapper.load_companies(country='DEU')[source]
Load dummy datasets for either Germany (“DEU”) or Italy (“ITA”). These contain the name of the 100 companies with the largest estimated number of employees for each German state (NUTS 1) or each Italian region (NUTS 2). The data was obtained from the 2019 Global Company Dataset published publicly by People Data Labs.
- Parameters
- countrystr, optional (default = “DEU”)
If
country = "DEU", loads the German dataset. Ifcountry = "ITA", loads the Italian dataset.
- Returns
- DataFrame
The DataFrame corresponding to the chosen country.